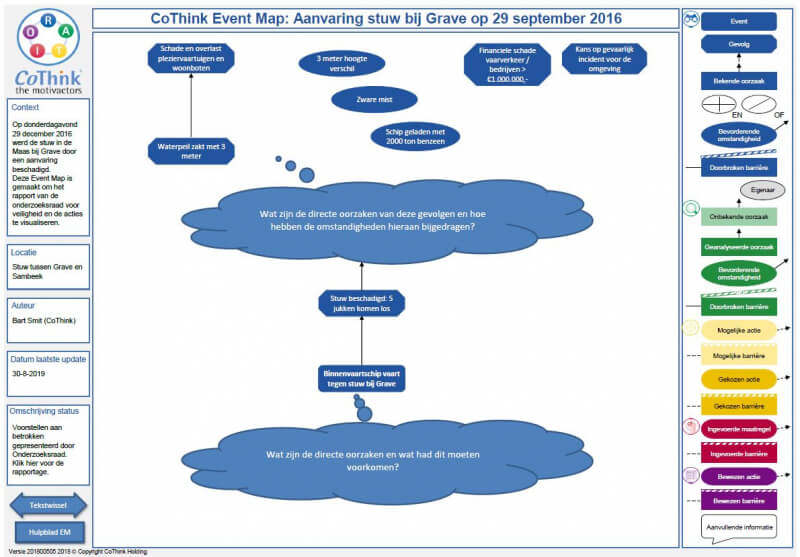
24-08-2020 On December 29, 2016, a ship was sailing through the dam at Grave. The consequences for shipping and houseboats were great. The water level dropped 3 meters, forcing ships to change their routes and damaged houseboats due to the low water level. An emergency repair was completed on January 24, 2017, which had caused ship traffic to recover only the consequences and symptoms.
The ship that went through the dam carried the toxic benzene which fortunately was not leaked in large quantities. Otherwise, the impact on the environment and the people living in the neighborhood would have been much more serious.
The cause was unclear from the beginning. Literally, that night there was a dense fog which also meant that the emergency services did not know exactly what was going on. In addition, everyone wondered how the skipper could not notice it.
The Research Council for Safety (OVV) conducted a thorough analysis that was very well visualized on this
page. We would like to add another Event Map to visualize the causal chain. It is derived from information from the report and takes you step by step into the chain of cause and effect. By visualizing the actions from the report in the Event Map, it becomes clear how these actions address root causes, not just the consequences and symptoms.
We have created two Event Maps:
1. the summary based on the consequences and questions in the first few days following the accident;
2. An Event Map based on the OVV report.
Enjoy your viewing!
before analyse after analyse